Create a Trend
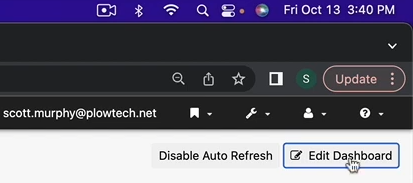
Open the dashboard and begin by selecting ‘Edit Dashboard’.
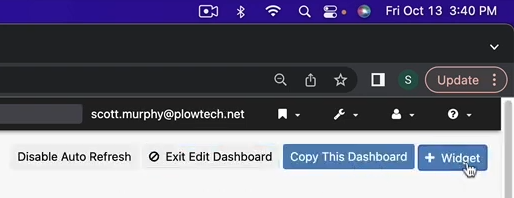
Next, select ‘Add Widget’ to incorporate a line graph.
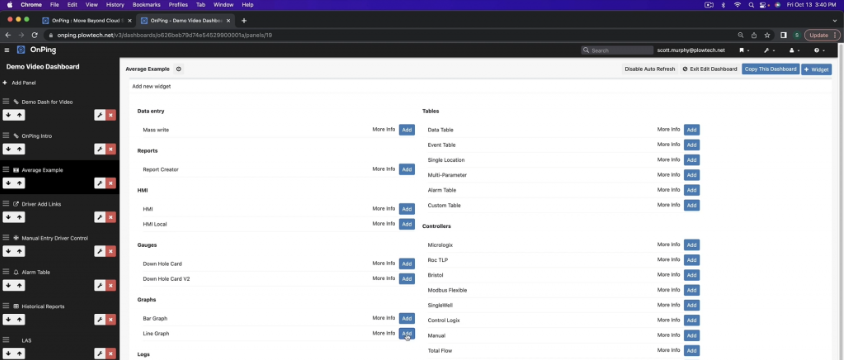
In the Graphs, Line Graph section, select the ‘Add’ button.
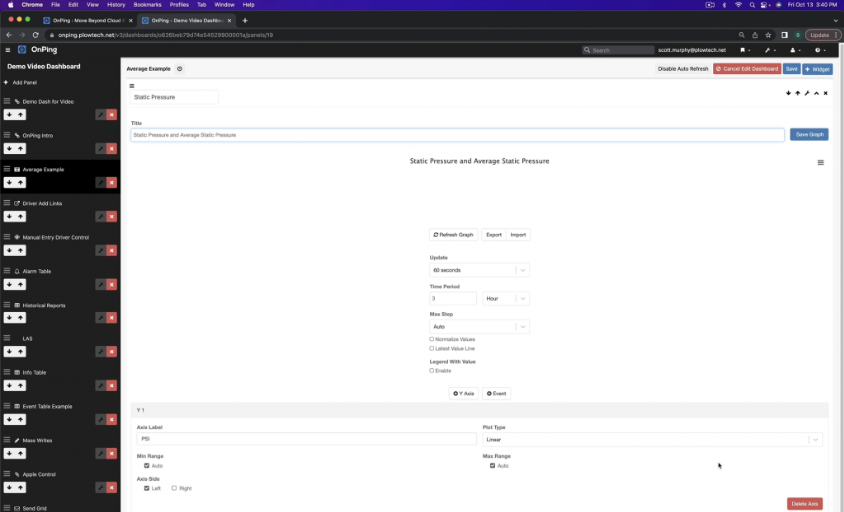
Assign a descriptive title to the line graph. For instance, if adding static pressure, title it appropriately to reflect its content, for example, ‘Static Pressure and Average Static Pressure’ is used for the graph title, the object is renamed to ‘Static Pressure’, and the Axis Label is updated to ‘PSI’.
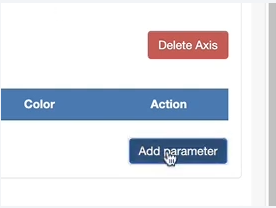
Proceed to include the desired parameter by selecting the ‘Add parameter’ button.
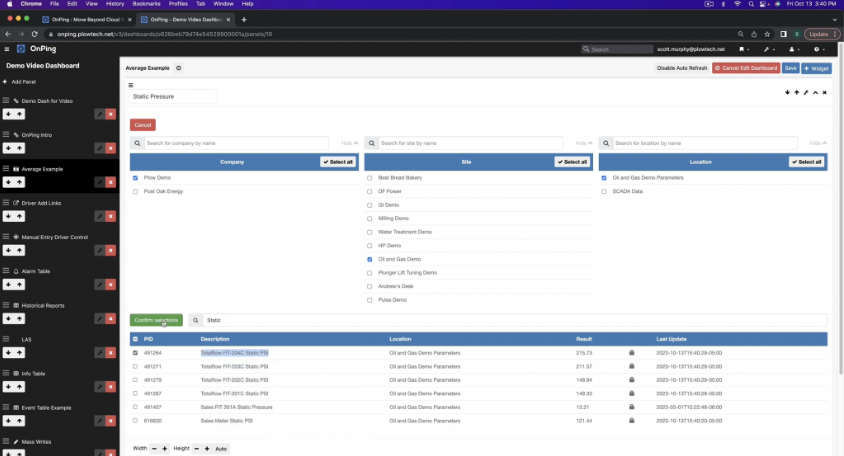
In the following example, a parameter from the demo site is used. Specifically, from the ‘Oil and Gas Demo’ site and ‘Plow Demo’ company, the parameter ‘Totalflow FIT-204C Static PSI’ is selected.
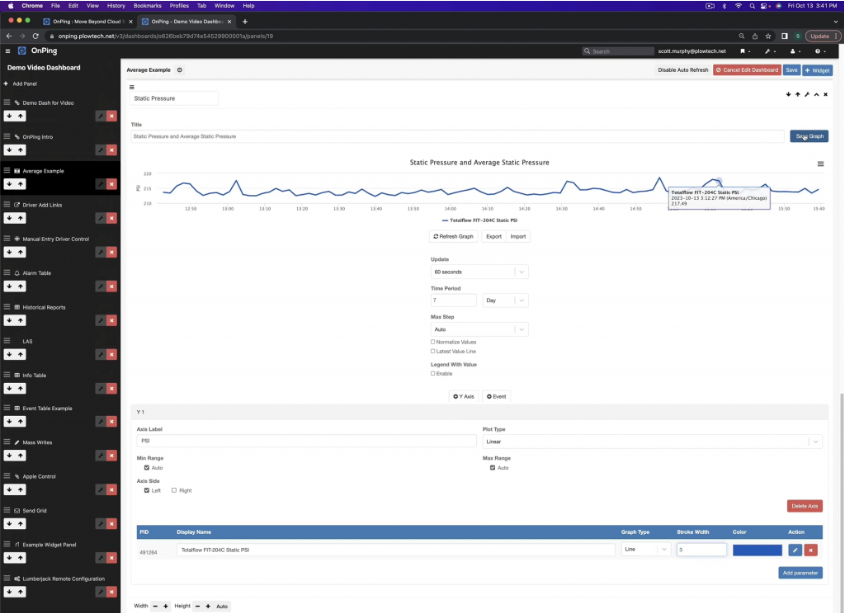
In the example, the time range is adjusted to seven days, and the thickness is set to ‘3’ for a denser trend appearance. Once satisfied with the settings, save the changes.
This results in a seven-day overview display of the static pressure on the graph.
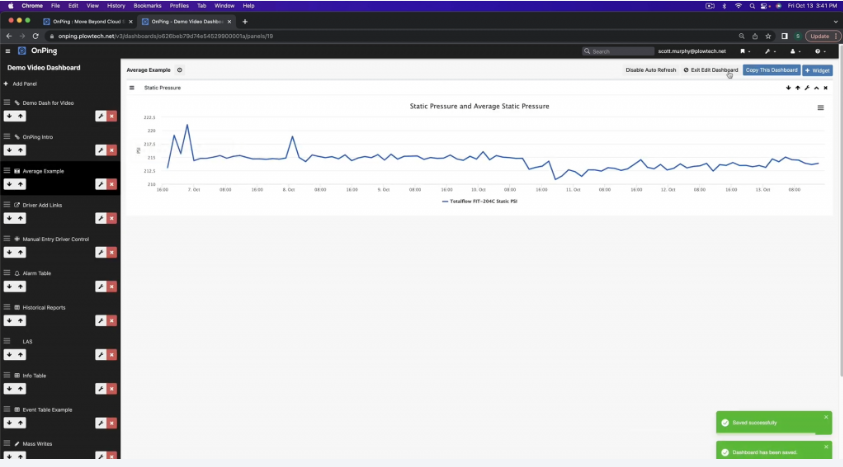
After the save operation, select ‘Exit Edit Dashboard’.
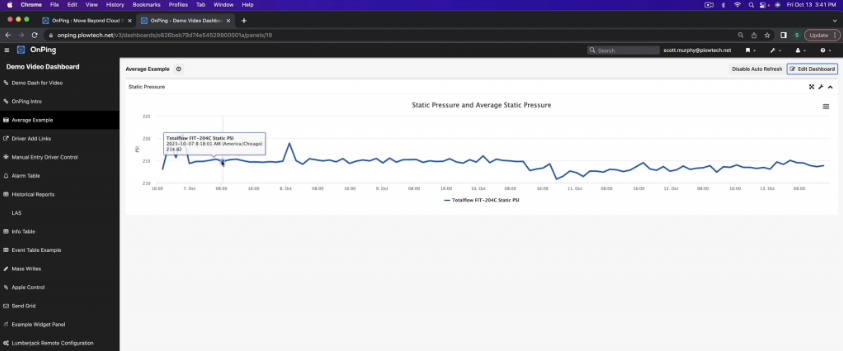
The creation of a seven-day trend overview for static pressure is now complete. The next step involves adding an average static pressure to smooth the data visualization.
Add a Virtual Parameter
A virtual parameter will be created to add an average static pressure. To overlay a virtual parameter on the graph, first create one. Begin by selecting the bookmark icon, then navigate to ‘Virtual Parameters’.
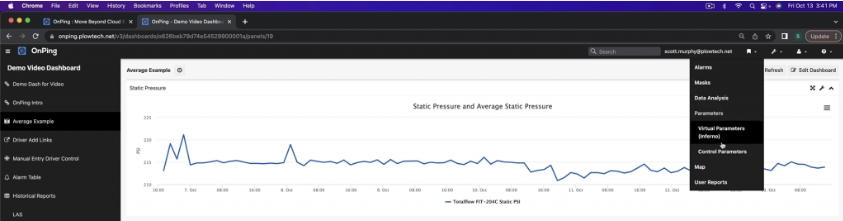
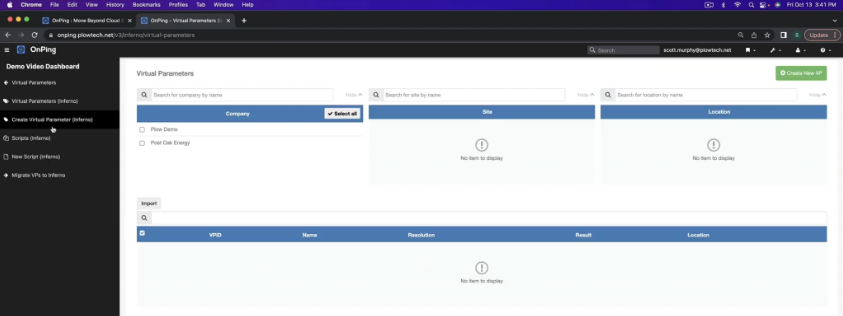
Proceed to ‘Create Virtual Parameter (Inferno)’ on the left-hand side menu pane.
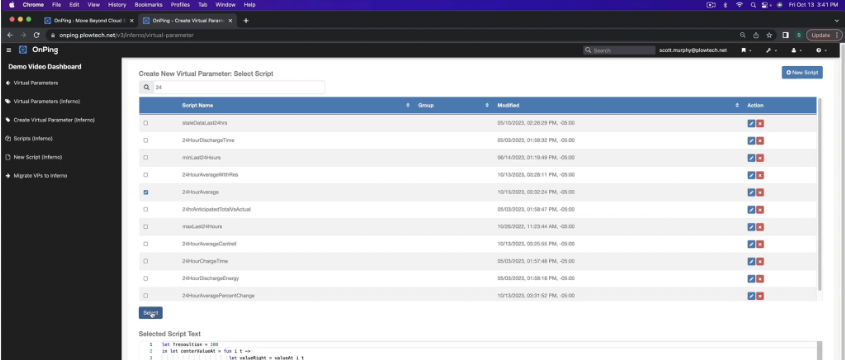
Search for a ‘24HourAverage’ option, select it, and confirm by clicking the ‘Select’ button.
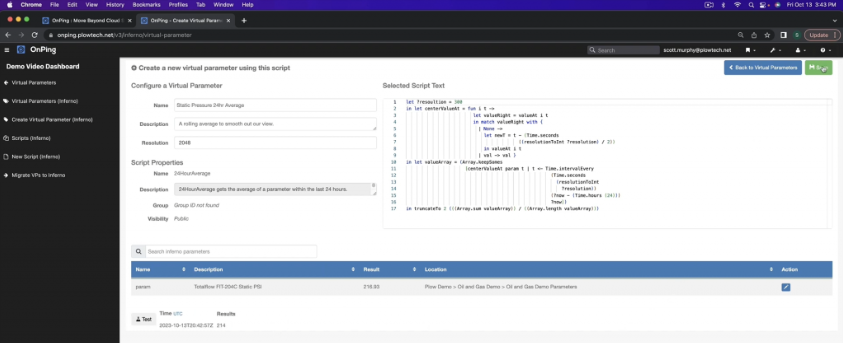
In the example parameter is named ‘Static Pressure 24hr Average’ to indicate its purpose of smoothing the data view. The description is ‘A rolling average to smooth out our view.’. The resolution setting is not a concern, as it is already configured in the graph. After the required configuration is finished, select ‘Assign Parameter’.
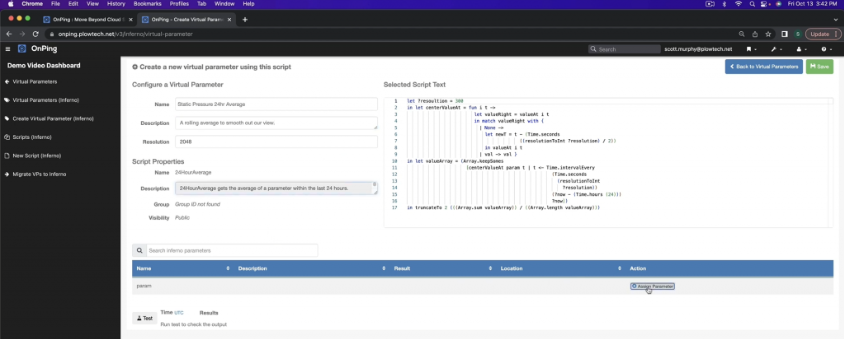
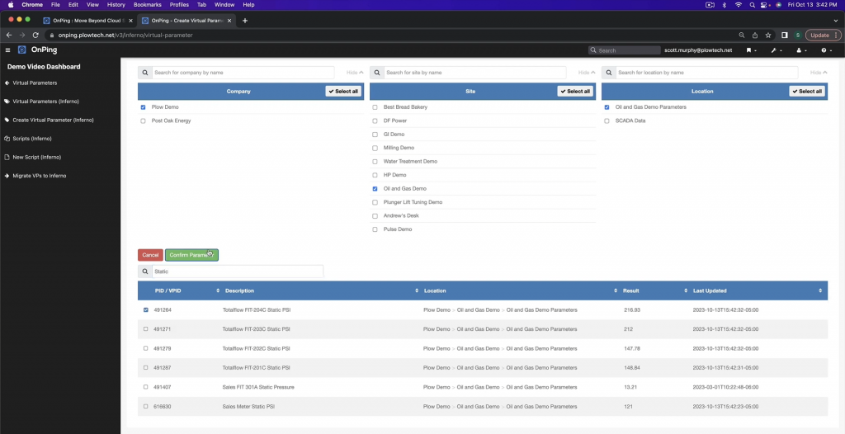
Select the previous parameter. In the following example, the ‘Totalflow FIT-204C Static PSI’ parameter from the ‘Plow Demo’ company and the ‘Oil and Gas Demo’ site is used.
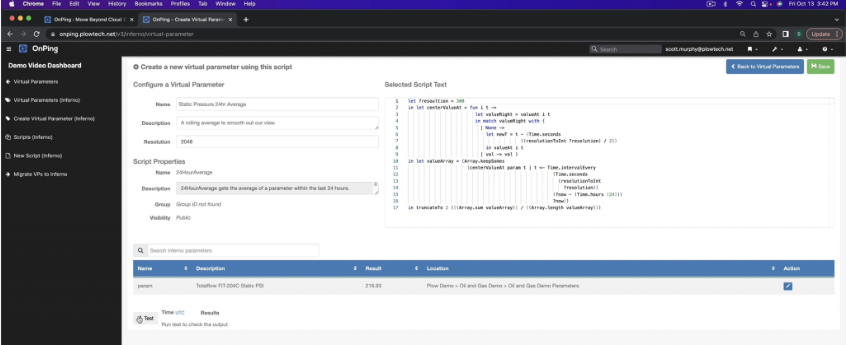
Test the newly created parameter for functionality by selecting the ‘Test’ button.
The result appears sufficient.
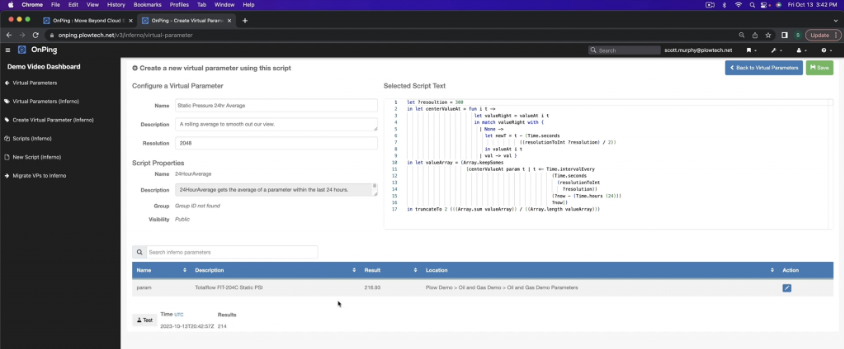
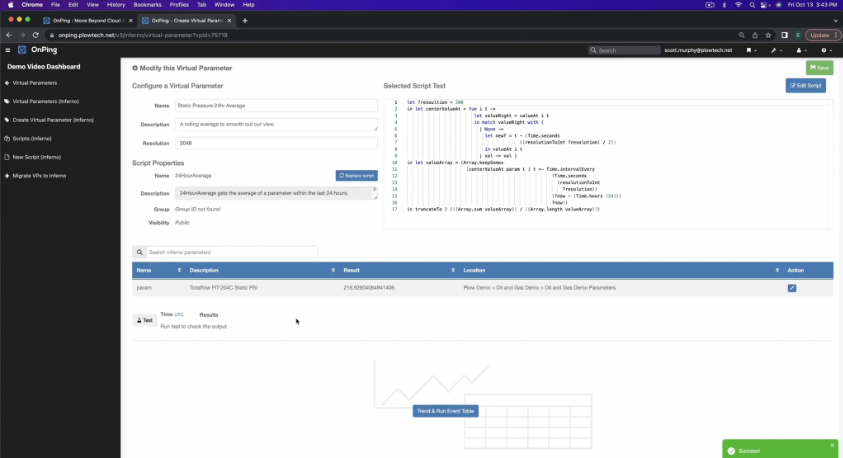
Proceed to save the changes.
Initiate a trend and run a test to ensure proper functionality, by selecting the ‘Trend & Run Event Table’ button.
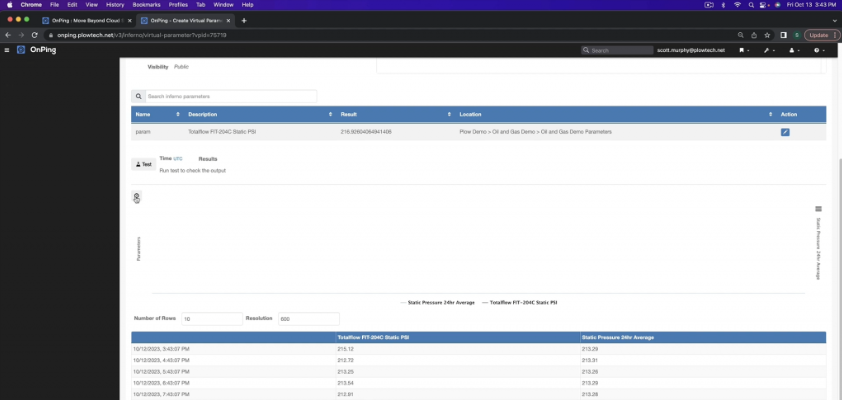
Select the clock icon to trigger a trend display.
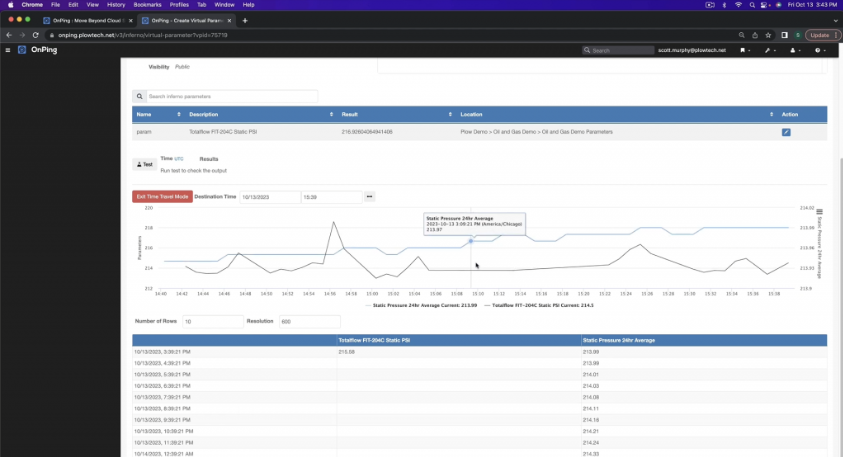
The 24-hour average is displayed alongside the data from the last hour, presenting a comprehensive view.
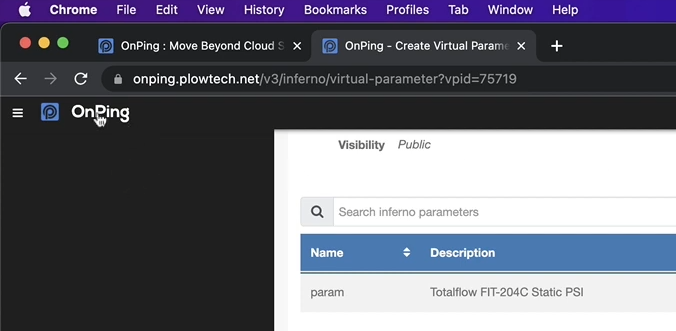
Having verified the setup, it’s time to integrate this into the graph. Click on the ‘OnPing’ in the left-hand side menu pane, to return to the dashboard screen.
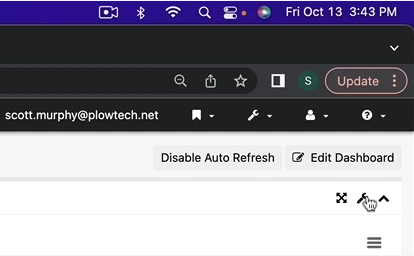
To edit the graph select the wrench icon.
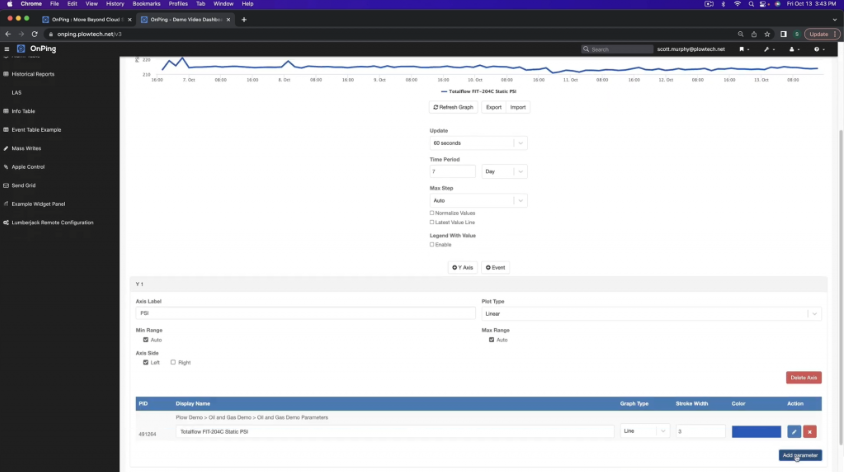
Navigate to ‘Add Parameter’ to include the newly created static pressure.
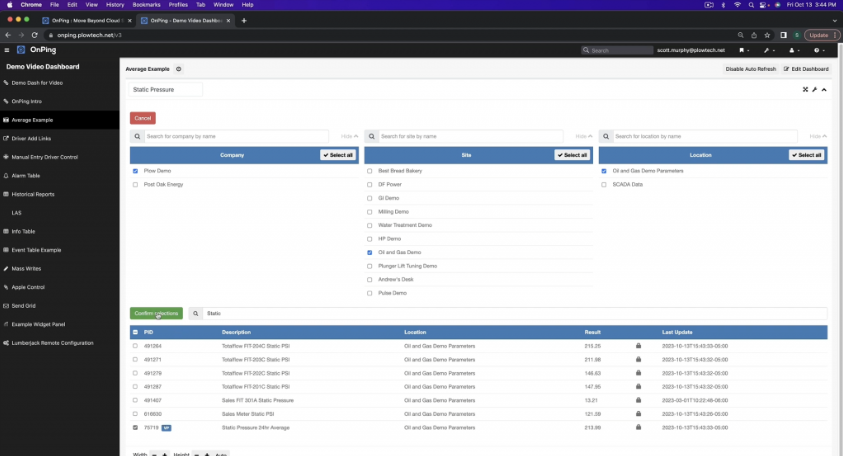
Select the ‘Static Pressure 24hr Average’ that was created, it is located under the same category as the original parameter. Notice the ‘VP’ indicator that indicates this is a virtual parameter. Select the ‘Confirm selections’ button.
Adjust the ‘Stroke Width’ setting for the virtual parameter to ‘3’ which enhances its visual appeal. In the example, the color was adjusted to the shade of yellow. Save these modifications for an updated graph presentation, by selecting the ‘Save Graph’ button.
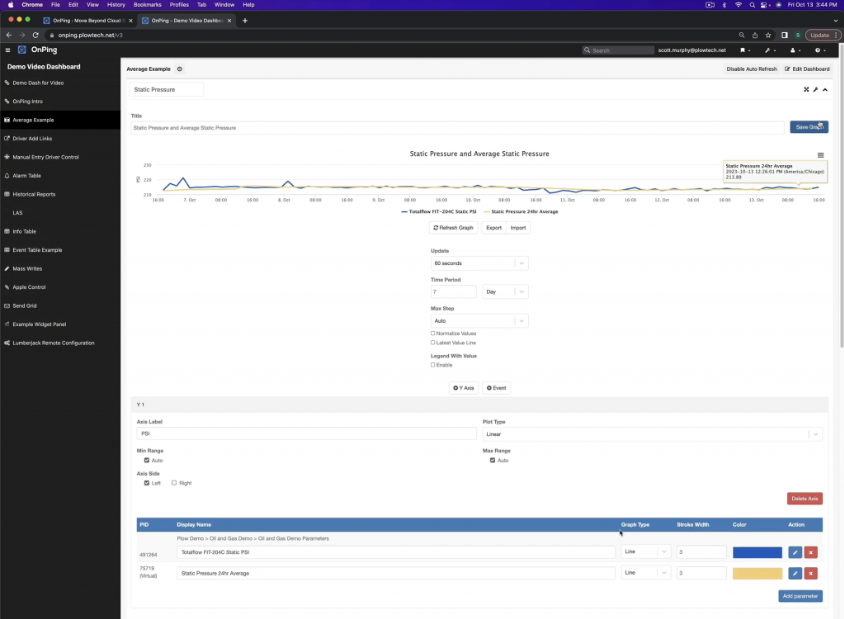
Select the wrench icon to access the dashboard screen.
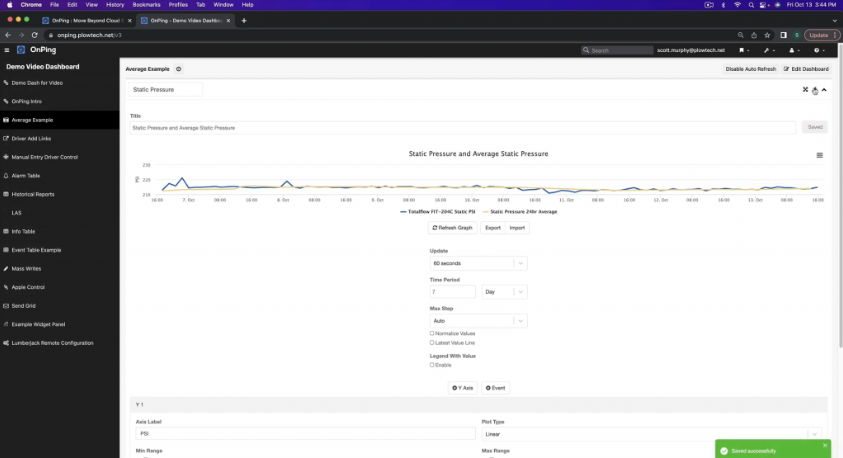
The setup includes the original ‘Totalflow FIT-204C Static PSI’ parameter, now augmented with a 24-hour average.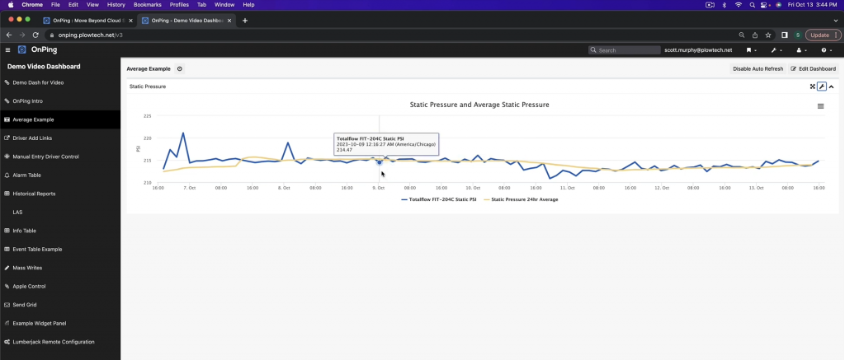
Conclusion
Creating a virtual parameter enhances data visualization by providing a smoother view. For example, tracking static pressure over different periods shows historical trends. The unique aspect of virtual parameters is that they are calculated in real time when the graph loads, hence the term ‘virtual’. These parameters are not stored but derived from existing data, such as static PSI. This allows for on-the-fly, dynamic calculations, with averaging being a common application. Such functionality enables diverse computational possibilities.
Was this article helpful?
That’s Great!
Thank you for your feedback
Sorry! We couldn't be helpful
Thank you for your feedback
Feedback sent
We appreciate your effort and will try to fix the article