Introduction
OnPing provides an easy way to diagnose and display the status of any active location for any company on the OnPing platform. An automated query determines whether there are any current issues with the location and displays the status along with other information about the location.
How to access the location diagnostics
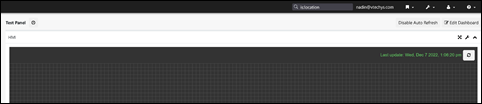
To access all the locations you have access to, enter is:location in the search box at the top of OnPing.
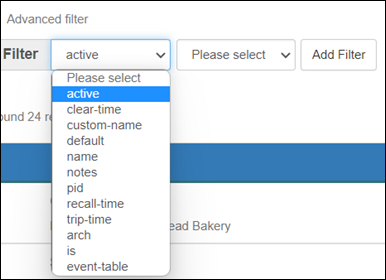
A list of locations, along with the company name, will appear in a grid. You can filter the list by selecting a criterion from the Advanced Filter drop-down.
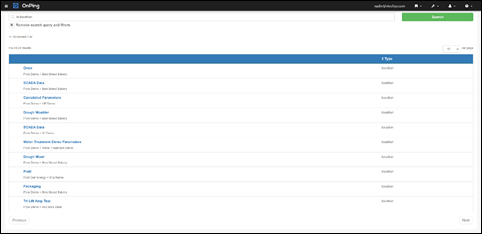
Once you see your desired location in the grid below the filtering area, you can click the location name to view the detailed status for that location. The location names are hyperlinked and appear in blue, bold font in the list.
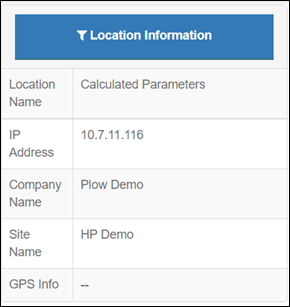
Clicking on the location name will transition you to a new page. On top of that page, you can view various information about the location. The location name, IP address, company name, site name, and GPS address, if available, are displayed.
Just below the location data, a green check will appear to indicate that the location is not experiencing any issues at that moment. This is done by sending an automated diagnostic ping to the location.

The screen will also display the list of parameters and their current data values in a searchable grid form. You can search for any specific parameter name that you need to investigate further.
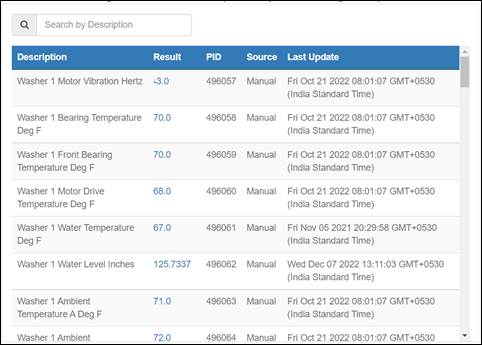
Parameter details
The data values in the parameter list grid are hyperlinked. Once you have identified the parameter you want to examine, click on the data value against that parameter. The data values are displayed in blue, indicating that they are hyperlinked.
Clicking on that will open a new page with a graph of the parameter value over a time period.
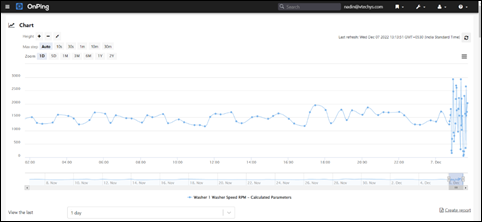
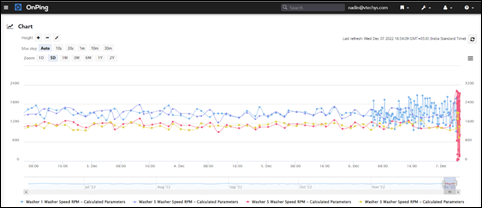
There are various ways to customize the graph – you can change the height, stop value, and zoom level, from 1 day to 2 years. You could also view a normalized form of the graph by checking the Normalize values check box and clicking on Apply Changes.

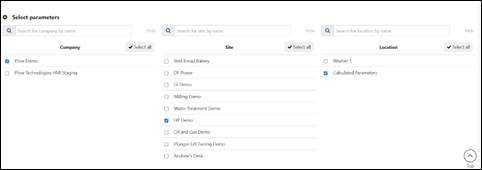
Underneath the graph formatting area, you will see a grid will all the parameters of that location listed, with their current data values. You could also change the company, site, and location to view another set of parameters.
You can select other parameters from the parameter list that you want to compare, and the corresponding data points will be overlayed on the existing graph (at the top of the page).
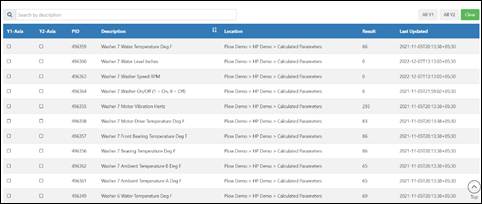
The different parameters will appear on the graph in different colors to give you an aggregated view of the selected parameters.
Conclusion
The location diagnostic mechanism provides you with a way to view information about the location, check the location’s health status, and graphically analyze parameter values.
Was this article helpful?
That’s Great!
Thank you for your feedback
Sorry! We couldn't be helpful
Thank you for your feedback
Feedback sent
We appreciate your effort and will try to fix the article